Orchestration Wars - Dagster
Published on Apr 7, 2025
17 min read

Prelude
Round 2 of this blogpost series.
We looked at Airflow. Now it is time for Dagster. There are plenty of articles doing a comparison between these two, including by Dagster themselves.
Like before however, the focus here is on using these tools from the perspective of the engineer.
We shall follow the same categories. Do take a look at the explanations in the previous post as to why these categories were chosen.
History Lesson
Dagster is developed by DagsterLabs, formerly known as Elementl. It was founded by Nick Schrock, known for his involvement in creating GraphQL at Facebook.
The core of Dagster is open source on GitHub with over 12k stars. The project shows a lot of activity and several customers are highlighted on their website.
In contrast to Airflow, it is not an Apache project, being alive due to the company behind it.
Core Concepts
Dagster is a data orchestrator built for data engineers, with integrated lineage, observability, a declarative programming model, and best-in-class testability.
As mentioned on their website, Dagster is still about building a graph, however the graph nodes here are assets. This means data, be it blobs, tables, files, etc. This is a subtle yet powerful contrast to Airflow. We are no longer thinking about just chaining units of work, but also their output and all the other components required in a data pipeline.
The entire data model may seem quite complicated. Arguably, the most important to recognize are:
- assets ~ tables, files, machine learning models,
- ops ~ the smallest units of work, so computations or data processing steps,
- jobs ~ the main compute abstraction,
- definitions ~ the glue for everything.
Where it gets interesting is those special cases. Dagster already provides abstractions for multiple ops that may or may not be related to an asset via a graph. There are io managers and resources for configuring connectivity details and external data sources. We also have sensors and schedules for orchestration, alongside some other neat abstractions we will cover later.
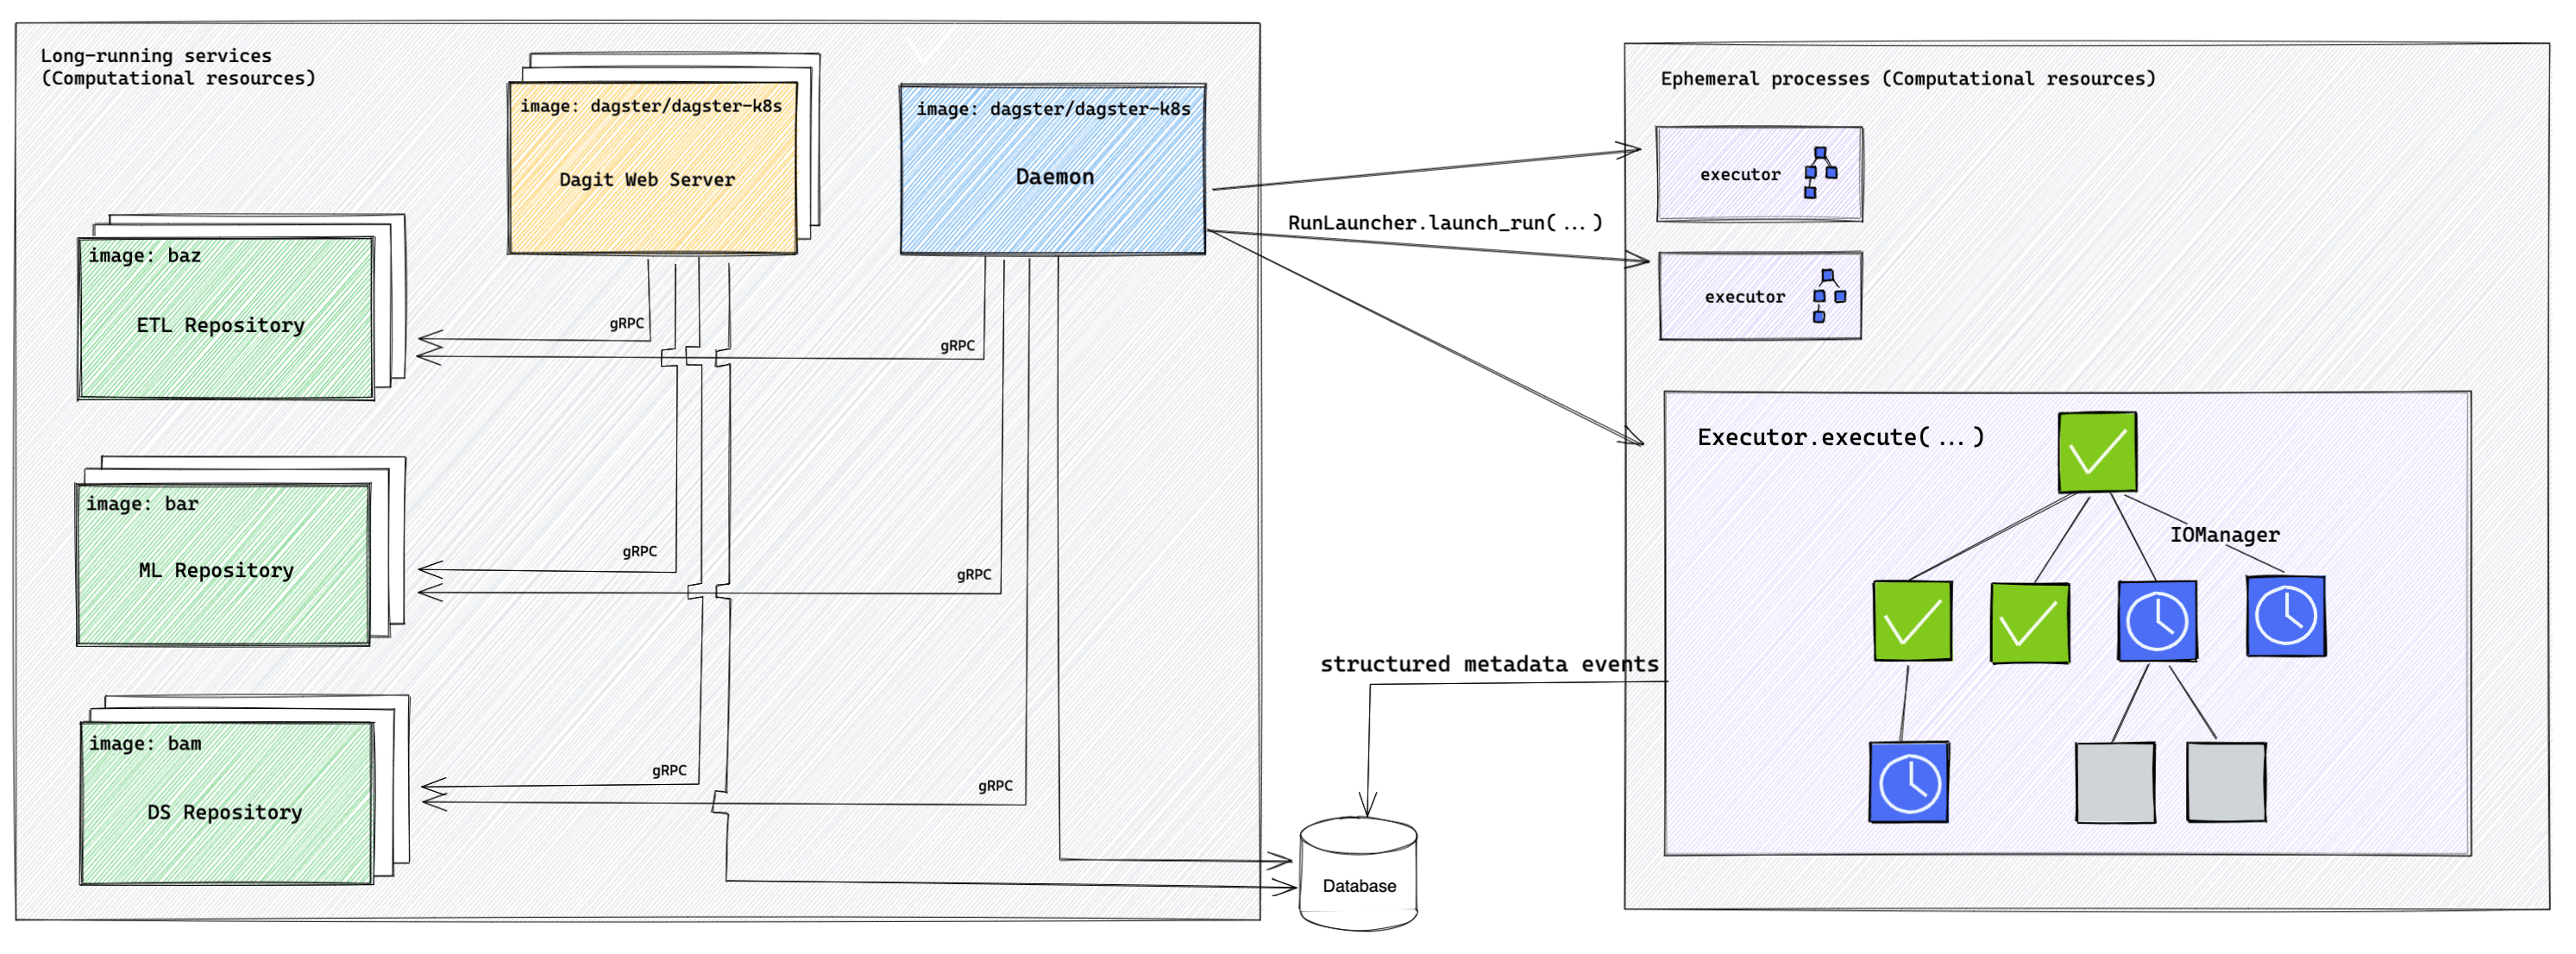
The core components are:
- daemon to trigger and submit tasks,
- webserver for the UI,
- database for events, logs, and other metadata,
- code location server to serve user code.
Deja vu?
A neat difference here to Airflow is that code locations are by default meant to accommodate multiple repositories and teams. Each code location might have different dependencies too. This natively distributed setup automatically accommodates large teams which only need to care about managing their own repositories and thus not depend on what others are doing.
Finally, like Airflow, we have many integrations, maintained by either Dagster Labs, or community and partners.
Dependencies
Oh boy, Dagster also has quite a lot of dependencies. There is however an arguably clear(er) split between the packages, as we have a subpackage with its own additional dependencies for each component. This along with the dependencies split between code locations assures a better separation of concerns.
In the wild
We have mentioned the integrations, which do include Databricks, cloud services, and others. Another view of these libraries can be seen here, emphasizing practical tools such as Prometheus and Datadog.
There is also an integration with OpenLineage, though oddly enough not really emphasized by Dagster. They do integrate with OpenMetadata more openly. Take from that what you will.
Dagster Labs are also quite open about the commercial product Dagster+, which simplifies deployment and manages the components for you. Dagster+ also provides other goodies tailored to big teams and complex pipelines, including an Asset catalog and Insights.
Deployment
Like Airflow, Dagster can be deployed anywhere. Really anywhere this time, including locally on Windows.
Locally
Set up your preferred env then:
pip install dagster dagster-webserver
dagster dev
And this is it :)
Or almost.
Likely need to configure the code location(s), or simply pass the file for quick tests,
where examples.py includes the Dagster Definitions.
dagster dev -f assets/examples.pyAnd the UI will be by default at localhost:3000.
OS
No issues here. Runs anywhere :)
Docker
The documentation has a great guide here on how to setup dagster via docker compose.
The same example yml can also be seen here.
Kubernetes
Let’s use kind and Helm to try it out on our machine.
After installing the tools and their requirements, all we need is essentially:
kind create cluster
helm repo add dagster https://dagster-io.github.io/helm
helm install my-dagster-release dagster/dagster --namespace dagster --create-namespace
After which one must configure code locations, i.e. where to look for Dagster definitions.
API
As hinted before, Dagster has an arguably complex data model with many components to know about.
However, let’s stick to the main ones.
The recommended way to use Dagster is via decorators.
Technically, one could also use the internal AssetsDefinition directly.
Though why deviate from the recommended (and most-tested) pattern?
import dagster as dg

@dg.asset
def table1(context: dg.AssetExecutionContext) -> None:
    context.log.info("Hello, world table1!")


defs = dg.Definitions(assets=[table1])
The above is a simple example of an asset.
Note the asset decorator, to which we can add additional configuration, such as the assets it depends on.
This will pop up in many of the later examples.
The function also returns None.
The asset functions must handle the IO themselves, though there are several utilities provided by Dagster,
as we’ll see soon enough.
We then have the context, which is an optional param which gives access to the AssetExecutionContext.
This context then allows one to access utilities such as logging, run ID, etc.
Lastly, note the definitions. This is the place to connect Dagster components together, conceptually similar to an Airflow DAG. Here we can add schedules, jobs, asset_checks, and many more.
And how do we link assets exactly?
The recommended approach is via deps in the asset decorator:
@dg.asset(deps=[table1])
def table2(context: dg.AssetExecutionContext) -> None:
    context.log.info("Hello, world table2!")
Note that this doesn’t imply that table2 can access table1 directly via an arg.
It simply adds an edge between the two tables in the graph to mark this dependency.
One could however use an alternative approach to implicitly allow reading the dependency directly:
import pandas as pd
from dagster_duckdb_pandas import DuckDBPandasIOManager

@dg.asset
def table3(context: dg.AssetExecutionContext, table1: pd.DataFrame) -> None:
    context.log.info("Hello, world table3!")
This requires setting up an IO manager, such as via DuckDB, and linking it to the definitions. What this means is that dagster will use a predefined location and library for reading and writing. So essentially we offload this challenge to a library.
defs = dg.Definitions(
    assets=[table1, table2, table3, table4],
++    resources={
++        "io_manager": DuckDBPandasIOManager(database="examples.duckdb", schema="public")
++    },
)
And for a codebase centered on classes, one could manually wrap in functions decorated as assets:
class Table4Builder:
    def compute(self):
        return "table4-data"

@dg.asset
def table4() -> None:
    Table4Builder().compute()
Or alternatively, write an asset factory, or even hack something using Dagster’s super classes.
In any case, what we see is plenty of flexibility. The lineage is handled a bit more implicitly, or say localized to each asset. One does not need to manually build a graph in one place because Dagster does it for you.
Features
As in the Airflow post, we already assume that Dagster:
- has a UI with an overview of all the assets,
- can schedule those assets,
- has logging and alerting capabilities.
Here we go a bit deeper into specific topics.
Uber-Graph
Can we link graphs together or have sub-graphs?
A tricky question, because really Dagster does everything automatically for us. There is no graph to manually maintain. One simply lists the assets an asset depends on, and that’s it.
There are however some cool details to mention.
We have briefly talked about code locations, namely how assets and code can be structured across repositories. However this can work on a per-file basis too. Dagster provides a global overview graph of all the assets, where each code location gets its own minimize-able graph.
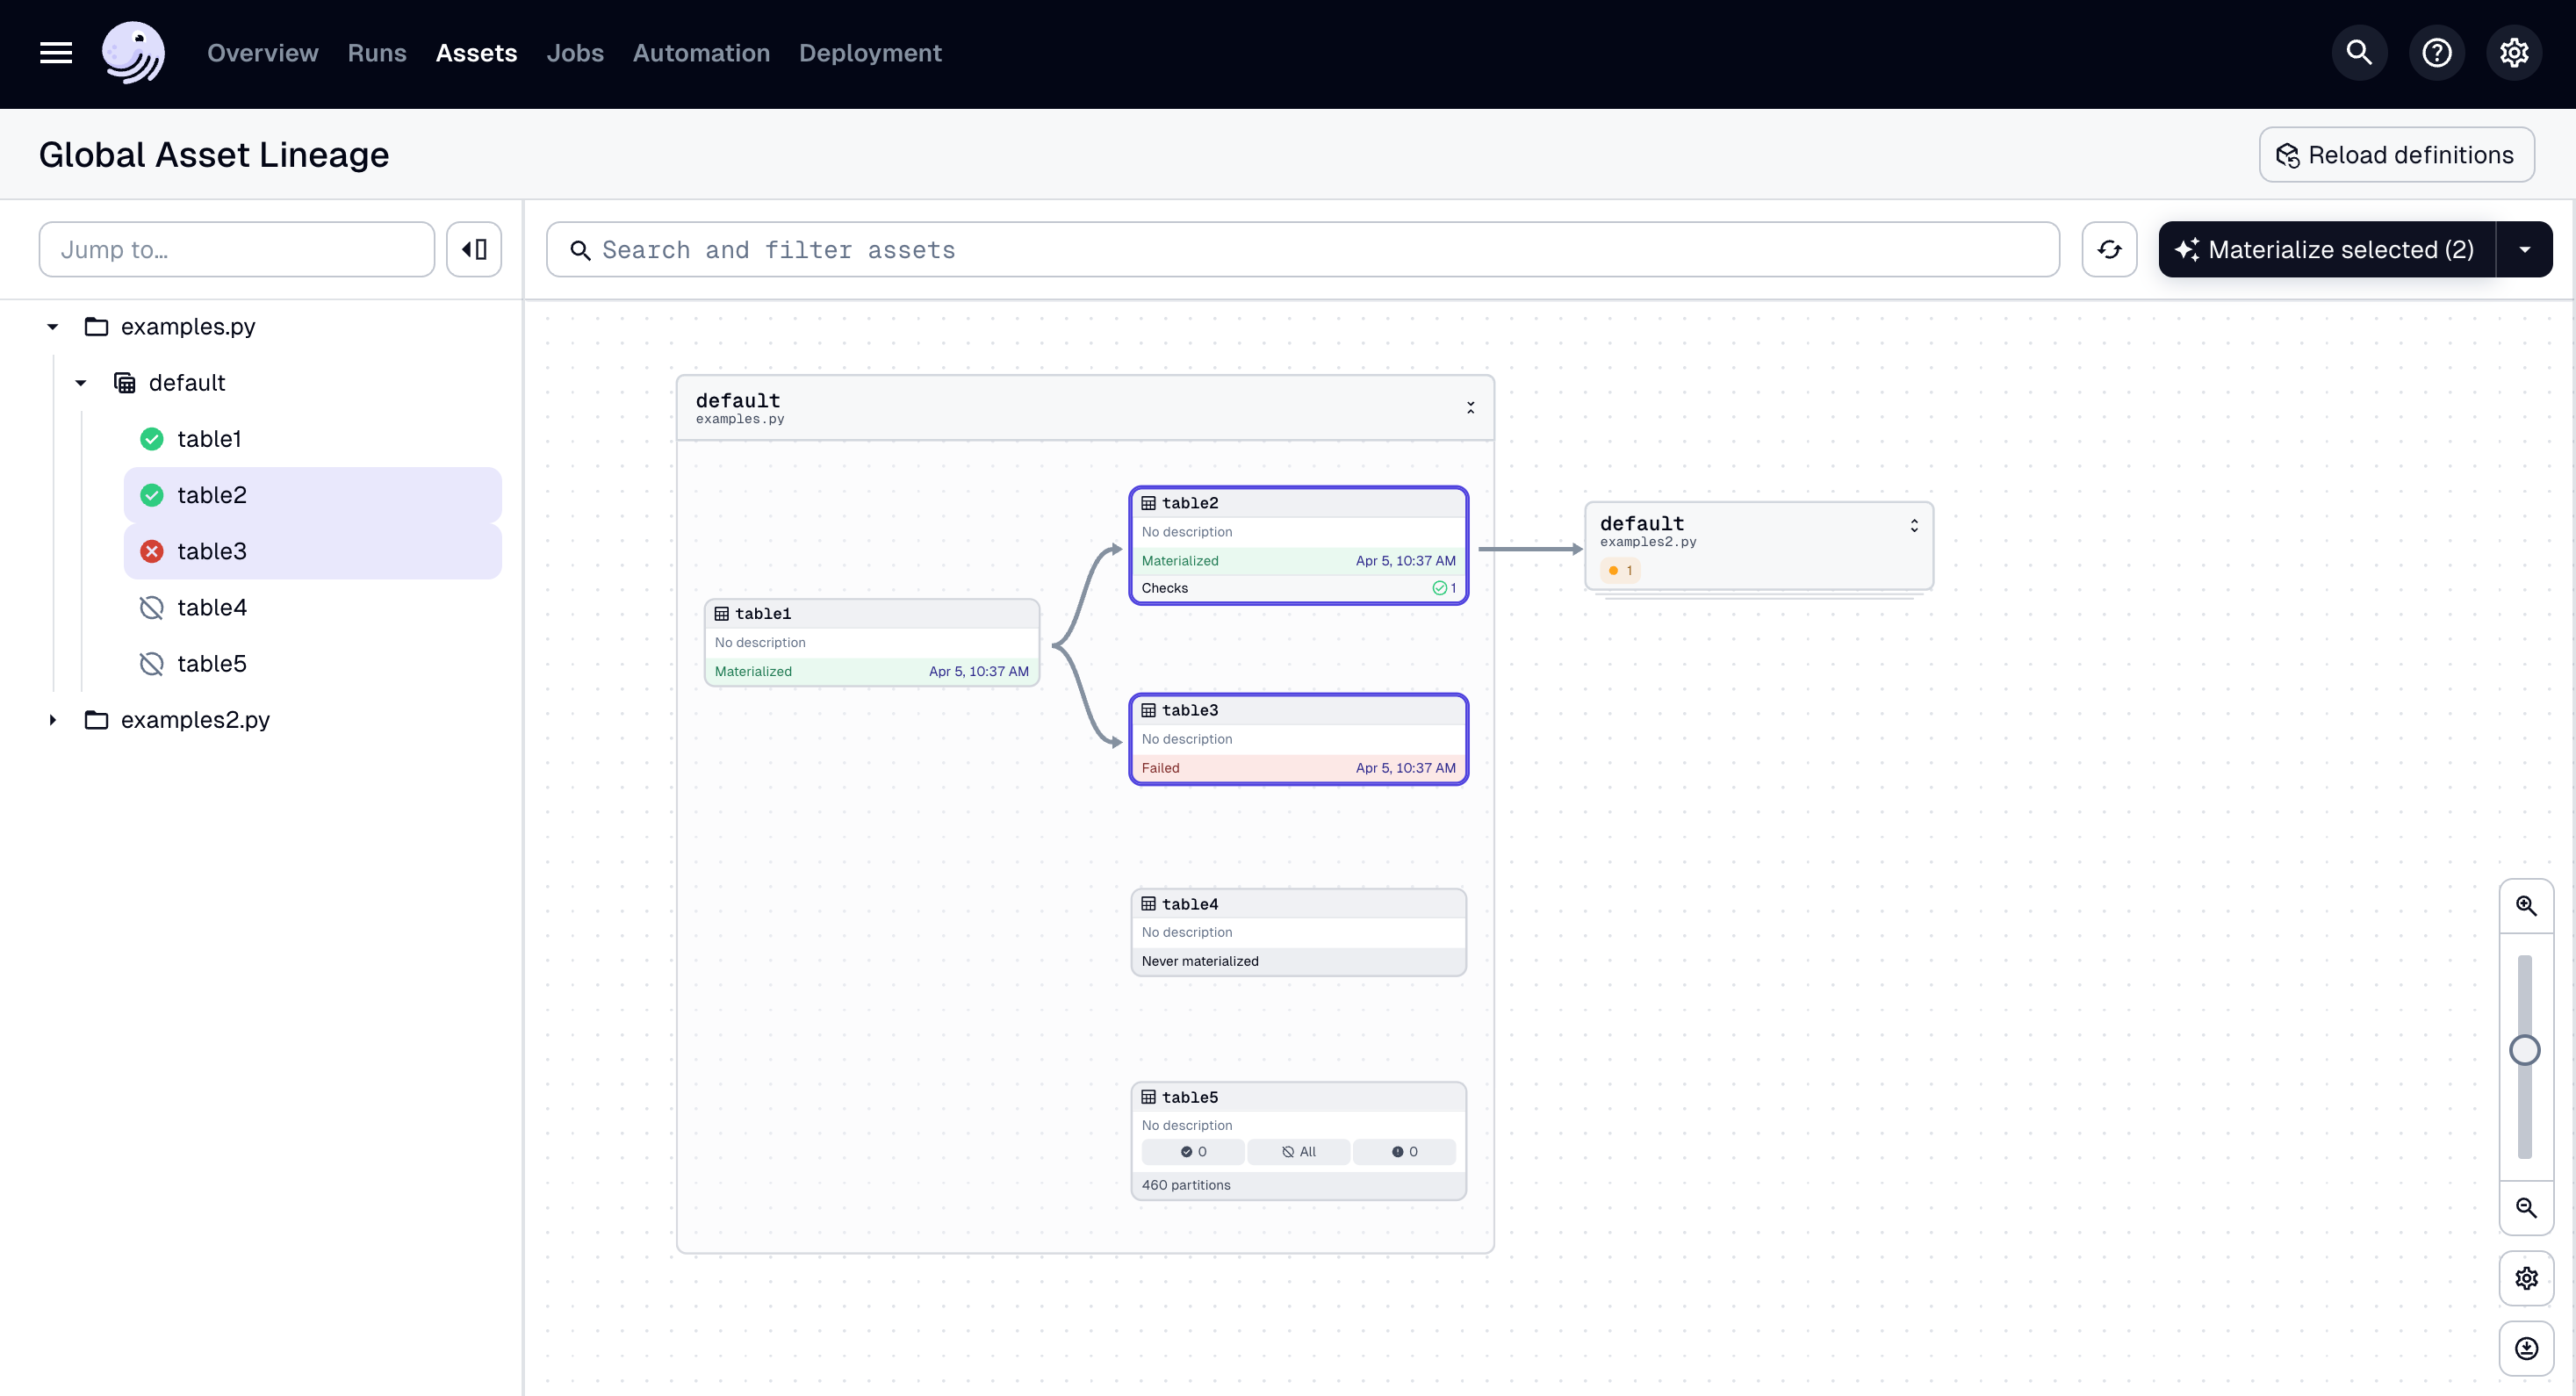
So this was about the UI. Functionality-wise, one can link dependencies across code locations too, simply by using a string for the asset name as opposed to importing that asset. This is an important step against dependency hell.
# in a different code location
@dg.asset(deps=["table2"])
def table42(context: dg.AssetExecutionContext) -> None:
    context.log.info("Hello, world, I use table2 from elsewhere!")
Then we still have sensors that can poll a location for updates (or even whether an asset has been materialized), then trigger assets when the condition is fulfilled. This will be exemplified in the next section.
Perhaps another option is using a graph_asset for grouping op’s together.
But let’s keep it simple.
Triggers
We have, perhaps expectedly, cron schedules and sensors. Let’s go through some examples.
To do this, we need to introduce the concept of a job.
A job is exactly what your intuition says: some code or logic to execute.
They can be of different types, but in the context of assets it could look like this:
daily_job = dg.define_asset_job(
    "daily_reload", selection=["table1"]
)
daily_schedule = dg.ScheduleDefinition(
    job=daily_job,
    cron_schedule="0 2 * * *",
)
Note how we first define a job which is linked to reloading an asset, and a separate object to define the schedule for that job. Then both need to be added to the definition to be discovered by Dagster.
defs = dg.Definitions(
    assets=[table1],
++    jobs=[daily_job],
++    schedules=[daily_schedule],
)
A sensor could be used to poll a location for new files:
def has_new_files() -> bool:
    ...

@dg.sensor(
    job=daily_job,
    minimum_interval_seconds=5,
)
def new_file_sensor():
    new_files = has_new_files()
    if new_files:
        yield dg.RunRequest()
    else:
        yield dg.SkipReason("No new files found")
Note the minimum_interval_seconds argument, which means Dagster will wait 5 seconds between
checks for new files.
More accurately, 5 seconds since the previous completion;
think of it like a sleep(5) after new_file_sensor().
Then, like before, need to add the sensor to the definition:
defs = dg.Definitions(
    assets=[table1],
++    sensors=[new_file_sensor],
)
Wait, what about just triggering something when an asset in a different code location updates?
For that, Dagster has asset sensors, a short-hand form to achieve this, which looks like:
table4_job = dg.define_asset_job(
    "table4_job", selection=["table4"]
)

@dg.asset_sensor(asset_key=dg.AssetKey("table1"), job_name="table4_job")
def table1_data_sensor():
    return dg.RunRequest()
So when table1 is loaded, the sensor will trigger the table4_job. Neat!
Parallel DAGs / Tasks
Similar to Airflow, we have different layers of parallelization. There is an in-depth article here, however let’s go through some highlights.
First, conceptually. Since Dagster automatically builds a graph of all the dependencies, if it sees that an asset can be materialized in parallel to another (so they don’t depend on each-other), then it will attempt to do so.
One can further tune this via run executors.
These are configured per Definitions or job, more generically via the former, as seen below.
defs = Definitions(
++    executor=docker_executor
)
By default, it will use the multiprocess_executor which runs each op in a separate process.
Note that 1 asset is by default materialized via 1 job run containing 1 op.
There are several alternatives, noteworthy being celery, docker, and k8s job.
One can then tune the number of runs executed in parallel via concurrency.runs.max_concurrent_runs in the dagster.yaml, or define tags and configure via concurrency.runs.tag_concurrency_limits;
or even configure pools across runs.
Then a further level up are run launchers.
By default, Dagster will execute each run in a separate process on the same node as the job’s code location.
But we could use K8sRunLauncher, DockerRunLauncher, or several others.

Deja vu, Airflow-experts?
Then of course we can offload the compute elsewhere, for example to Databricks via PipesDatabricksClient.
Endless possibilities.
Coming back to the API side, there is a noteworthy related concept which Dagster handles very well: partitions.
They are a core concept here, with the example below splitting the computation per day.
More specifically, there will be an op for each partition, which means they can be parallelized.
partitions = dg.DailyPartitionsDefinition(start_date="2024-01-01")

@dg.asset(partitions_def=partitions)
def table5(context: dg.AssetExecutionContext):
    date = context.partition_key
    # fetch data for date
However, one must still be careful in writing the logic.
Reading the whole data in memory then filtering for that partition would be likely worse than having no partitions at all.
So the data source itself must provide some way to get data partitions, be it a WHERE clause, API pagination, etc.
Intercommunication
The asset abstraction implicitly expects each asset to read and write data from somewhere, so a storage
location such as files or a database.
This means that the recommendation remains to put all the logic required to materialize some data into an asset.
Where the computation is very complex, one could still split it into multiple functions or even use Dagster’s op abstraction.
Recall the previous IO manager example however. We used DuckDB to store data. DuckDB is in-memory, so one could easily store something there if required, without a big performance hit. One could also use some other manager to “pass” data between assets. Nevertheless, think of Dagster more as an asset manager, as opposed to a workflow manager. You manage and orchestrate the datasets, not the operations that may build those datasets.
Gimme resources
As in Airflow, Dagster is not aware of nor does it manage compute resources for us. If we schedule too many assets at the same time, more than we have resources for, then things will go wrong. This means one still needs to monitor the executions and tune the concurrency parameters mentioned before to ensure things run smoothly.
One should of course also consider the chosen run executors and run launchers. Depending on those, further tuning could be done. Say one uses Kubernetes, then one could for example add cluster nodes, split via namespaces, tune affinities, etc.
The implication here, particularly when working with constrained resources, is that choosing sensible triggering mechanisms (schedules, sensors, etc.) is still the developer’s responsibility.
Task Types
Long-running
While not recommended, yes! One could have long-running jobs, though technically split into many subsequent ones via sensors. This is different however to streaming.
Streaming
See the previous blogpost for more context, however with Dagster we have the same conclusion: it is not designed for realtime streaming.
One can simulate it via “micro” batches by fine tuning sensors, however this is still not a true streaming solution.
Blitz
Yes, it can handle small tasks effectively.
However the recommendations remain: do not split assets processing into multiple assets.
Each op has some overhead, no matter how small.
This is further increased when using docker, kubernetes, or other ways of executing our code,
each with additional overhead.
Yet recall the run executor configuration. One could easily override some particular jobs to simply run as a process, while maintaining the rest of the assets on a distributed setting.
Other Engines
As already hinted throughout, one can use any of the integrations available to offload the computations to another system. We have Spark, Databricks, AWS Glue, and so on.
Fault tolerance
Dagster has a clear delimitation between the components. So when one is down, only that particular part of the application will stop working. Say the websever is down, this means the UI will not be accessible but assets will still be updated by the daemon component.
The daemon is thus more critical. It should not have multiple instances running to avoid race conditions or other issues. However, as recommended by Dagster, this is where containerized solutions shine. One can, for example, easily configure a Kubernetes Deployment to maintain that daemon running.
Now that we talked about the platform itself, what about the assets and everything we configure?
An easy way to add resilience is by configuring a retry mechanism.
Dagster allows doing this on jobs and ops (and implicitly assets).
For example, one can setup exponential backoff as following:
retry_policy = dg.RetryPolicy(
    max_retries=3,
    delay=5,  # in seconds
    backoff=dg.Backoff.EXPONENTIAL,
)
table4_job = dg.define_asset_job(
++ op_retry_policy=retry_policy,Then let’s assume something still failed. One can easily manually materialize an asset via the UI. This includes partitioned assets, as one is able to simply add a range via the UI. This doesn’t make any logs disappear (or be “hidden”) either, as any previous failures are still kept in the database and visible in the UI.
Dev Flow
Unlike Airflow, Dagster can actually run anywhere.
This means any linter-like errors, e.g. is this asset configured in a valid way,
can easily be detected by simply opening the UI.
Then of course we have the CLI to do the same thing via dagster definitions validate,
assuming a standard project structure was followed.
One can also use the CLI for many other things, such as materializing an asset via dagster asset materialize.
When thinking about the logic inside the assets and jobs, one can simply import the decorated functions and run them locally. One can additionally pass any custom context to simulate more complex scenarios, such as partitioned assets or logging overrides.
At this point, one has made changes to some assets, tested their logic, and verified there are no import errors. The same notes as in Airflow apply. Testing with real data might not be possible, be it due to connection issues or simply data volume. These changes would need to be deployed somewhere more closely resembling production, in order to gather any final evidence that things will work as they should.
Testing
As hinted in the previous section, one can use the CLI to check for any import errors.
Then write any unit tests on the logic by simply importing the function behind an asset.
@dg.asset
def processed_file(loaded_file: str) -> str:
    return loaded_file.strip()


def test_processed_file() -> None:
    assert processed_file(" contents    ") == "contents"
There are many more examples available here, therefore this section seems long enough.
Validation
I actually didn’t know where to place this because the previous blogpost did not have such a category,
but it is such a nice feature that needs to be mentioned: asset_checks.
These are functions that run in a separate flow, i.e. can be scheduled differently, meant to assert the data quality of assets. The logic inside these functions can be really anything; counts, types, etc. As long as it can be implemented in Python, it works.
@dg.asset_check(asset=table2)
def table2_checks():
    return dg.AssetCheckResult(
        passed=True,
    )
defs = dg.Definitions(
++ asset_checks=[table2_checks],
)And while they seem like just any other function, it is great to have them as their own specific Dagster component, as now we can see these checks and their results in their own UI pane. This way, quality checks are rather built-in to the process. They can be scheduled differently without affecting, i.e. slow down, the overall data flow.
Some might even argue these checks are implicitly rather opinionated, as they are now treated as an “after the fact” validation, as opposed to “do not save if validation fails”. However this does not prevent anyone from implementing “before the fact” checks simply within the asset functions.
Review
You made it!
We have reached the most subjective section, namely how I would describe working with Dagster. What went smooth, what did not, what issues have I identified.

Disclaimer: I have not used Dagster outside personal experiments, therefore this blogpost might resemble a honey-moon phase. It was fueled by a desire to find something that builds on Airflow’s pain points; something more fitting to the current data landscape.
Setting things up was a breeze.
Everything was documented and up-to-date, at least as far as I was concerned about.
Did not require any real debugging, besides perhaps some confusion around the code location.
But that was my fault, as I had not followed the standard dagster init pattern.
The documentation is up-to-date (don’t trust your AI friend!) and concise. Implementing things felt easy and more importantly: intuitive. My only (minor) gripe is that finding the nice lineage UI pane is hidden behind some clicks, as opposed to making it the main view.
It is true that from an engineer’s perspective, one might not care much about auth, audits, and other “annoying” things. As soon as these topics come up, it is clear that’s where Dagster+‘s value proposition comes in. Unless paying for Dagster+, one will not get auth built-in and instead would need to set it up themselves. Similarly for alerts and other metrics.
Yet still, one can set up these things themselves over the open source dagster-core, which is maintained; Dagster+ would not exist without it! Whether this will still be the case in a few years, we don’t know. As of now, they have not filed for an IPO.
Summary
We went through several topics in an attempt to give a more realistic picture of using Dagster as an engineer, covering both challenges and day-to-day dev flow. We went over the deployment options, how the API looks like, and many use cases. We have seen the parallelization options, possible integrations, and fault tolerance. We have seen what makes Dagster unique and how it solves some of Airflow’s weaknesses.
Overall, I find Dagster a very good choice. Likely my top choice, when given the opportunity.
But is it the best orchestrator out there? We require more research! Perhaps the new kid in town will take the throne?
Addendum
We need more code examples!
Since this is a (very) long blogpost, will likely extract specific how-to’s in separate #short posts but with more examples. Stay tuned!